Voice on Trial: Forensic Speaker Comparison
Voice comparison now rests on likelihood ratios, calibration and case-relevant validation rather than visual “voiceprints.” Six sections explain the evidence and its limits.
The voiceprint was never a print
In 1966, Lawrence Kersta became the first voice-identification expert to testify in court. He said his "voiceprints" were as reliable as fingerprints.
Durand Begault and Fausto Poza later traced the claim to a Nature study in which novice high-school girls compared isolated words from twelve speakers. Reported error rates were 0% to 3%. The task was closed-set: the corresponding sample was always present, participants knew that, and they could compare freely among exemplars. Those conditions differ substantially from casework in which the true speaker may not be represented. Kersta also manufactured spectrographs and profited from examiner certification. The term voiceprint encouraged an analogy with fingerprints, although voices vary with health, age, emotion, effort and transmission channel.
Oscar Tosi's Michigan State research, funded by the US Department of Justice in 1968, reported false-identification rates of 2% to 6% and false-elimination rates of 5% to 12% under laboratory conditions. Tosi argued that casework would perform better because experienced examiners would decline difficult comparisons. Poza and Begault respond that the decision to proceed relied on subjective data-quality judgements without objective criteria. Casework also introduces imperfect channels and greater within-speaker variation.
When the National Academy of Sciences reviewed the field in the late 1970s, it concluded that available error-rate estimates "do not constitute a generally adequate basis" for courts to assess aural-visual voice identification. Poza and Begault wrote in 2005 that the conclusion remained applicable.
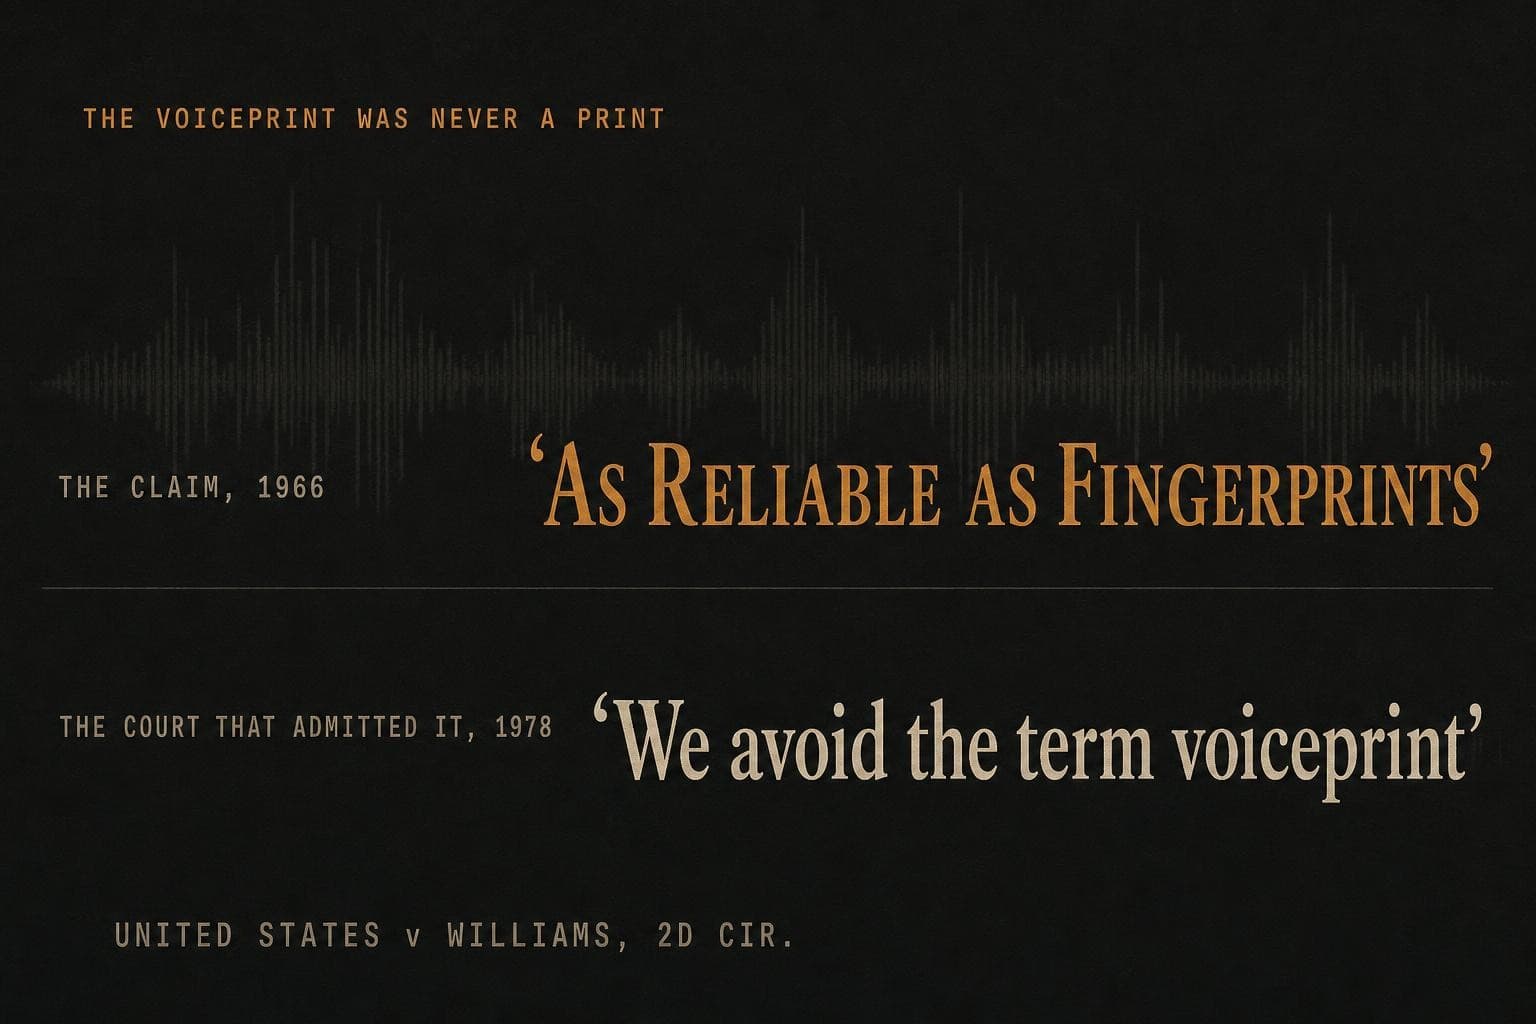
In 1978, the Second Circuit admitted spectrographic evidence in United States v Williams, relying on Tosi's 6.3% false-identification rate and analogies with handwriting and gun-barrel comparison. It described the central task as "the simple step of visual pattern-matching, a step easily comprehended and evaluated by a jury." Begault and Poza criticise that approach as subjective and impressionistic, noting the absence of evidence that trained examiners identify voices by ear more accurately than lay people. The expert, Lundgren, reported thirteen correspondences against a ten-point standard set by his trade association.
The court itself avoided the term voiceprint, writing that a spectrogram "has been often called a voiceprint. We avoid the term as potentially leading to an unwarranted association with fingerprint evidence." Current evidence should not be framed as visual voiceprint identification.
“A spectrogram has been often called a "voiceprint." We avoid the term as potentially leading to an unwarranted association with fingerprint evidence.”
Show me the study
Counsel holds up the witness’s report, where the spectrograms are said to "match," and asks for the evidence behind the method.
"You testified that the spectrograms ‘match.’ Can you point me to a single published study, on case-realistic recordings, that establishes the error rate of your eye-matching method, or did the National Academy of Sciences conclude in the 1970s that no such adequate basis exists?"
A likelihood ratio evaluates the evidence, not guilt
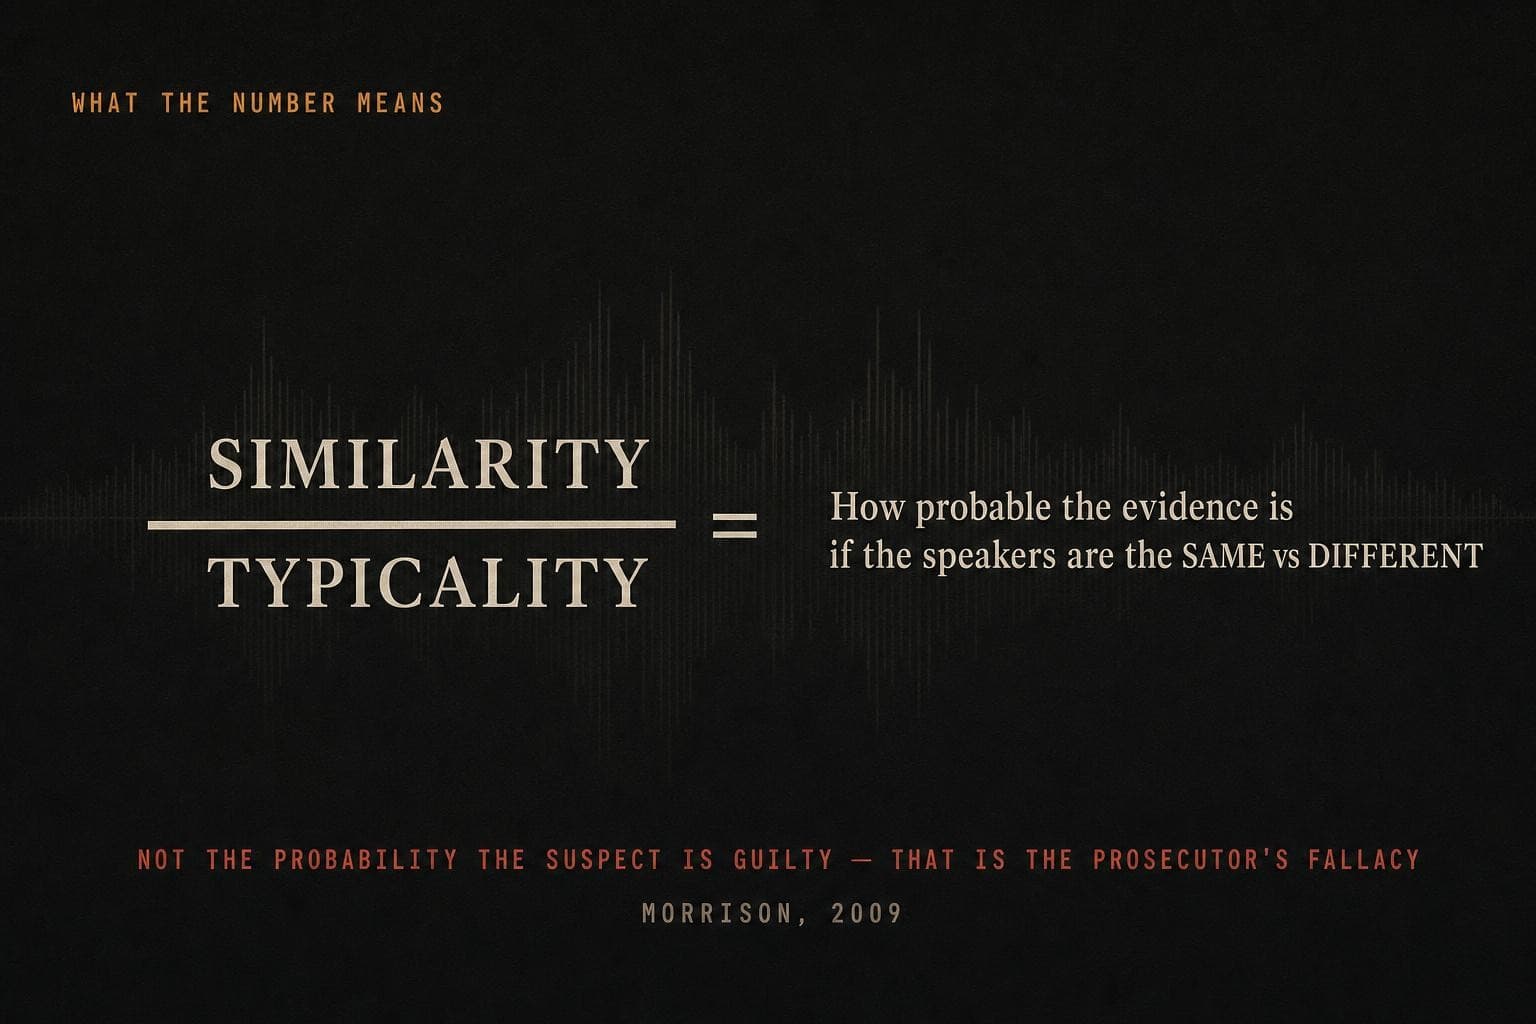
In 2009, Geoffrey Stewart Morrison argued in Science & Justice that forensic voice comparison was moving from categorical identification towards likelihood ratios, as DNA evidence had done in the 1990s. A likelihood ratio compares the probability of the observed voice evidence under a same-speaker proposition with its probability under a different-speaker proposition. An LR of 100 means the evidence is 100 times more probable under the same-speaker proposition. An LR of 1/1000 means it is 1000 times more probable under the different-speaker proposition. The numerator captures similarity and the denominator typicality; similarity in a common feature provides little support because it would also occur often among different speakers.
An LR is the probability of the evidence given each proposition, not the probability of either proposition given the evidence. Saying that an LR of 100 means the suspect is 100 times more likely to be the speaker reverses the conditional and commits the prosecutor's fallacy. A conclusion about guilt would also require prior information that belongs to the court.
Morrison's 2013 calibration tutorial explains that a raw system produces a score, not an interpretable LR. Calibration shifts and scales scores using known same-speaker and different-speaker data. In one worked example, calibration reduced log-likelihood-ratio cost from 1.802 to 0.750, where lower is better. Morrison distinguishes auditory, acoustic-phonetic and fully automatic approaches. In Cambier-Langeveld's 2004–2005 exercise, only four of twelve analysts reported an LR. The report should identify which type of system produced the value and what was calibrated.
“A likelihood ratio is an expression of the probability of obtaining the evidence given same- versus different-origin hypotheses. There are logical and legal reasons why the forensic scientist must present a strength-of-evidence statement in this form and must not present the probability of the hypotheses given the evidence.”
Does 100 mean it’s him?
Counsel reads the likelihood ratio back from the report and offers a tidy, wrong restatement of it.
"You testified to a likelihood ratio of 100, so it is 100 times more likely my client is the speaker on the recording, correct?"
Cllr must be measured under conditions like the case
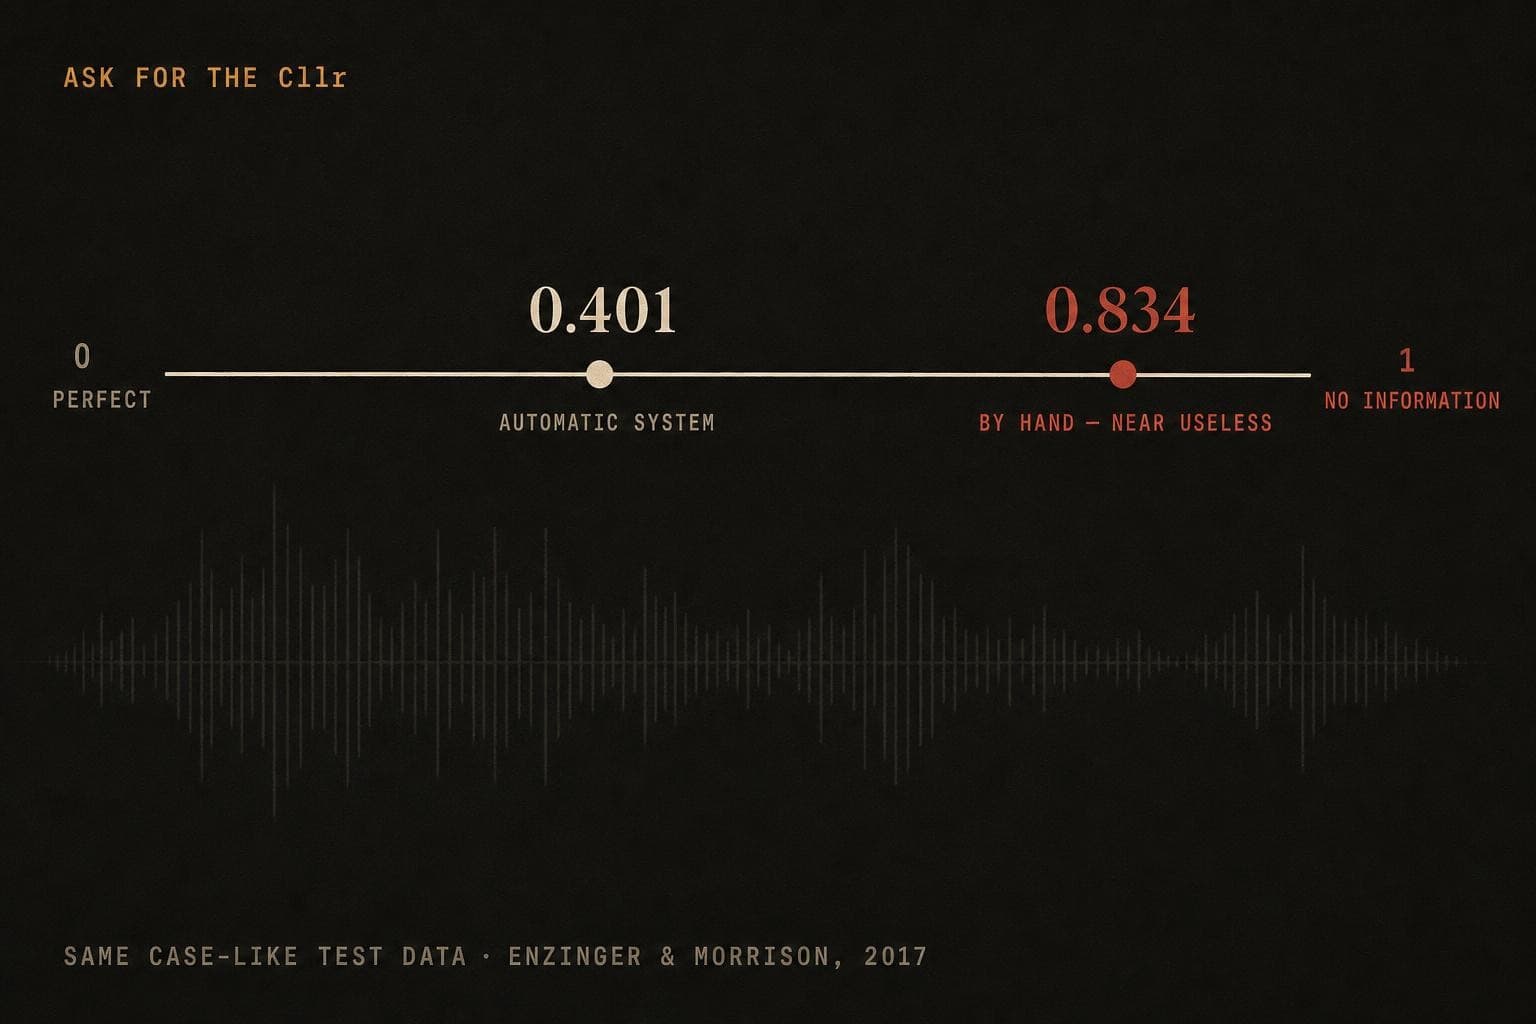
In a 2012 New South Wales fraud trial, a practitioner said there was "much to support a hypothesis that the defendant is the speaker," based on auditory assessment and spectrograms of the word "no." No performance figure for comparable conditions was given. Enzinger and Morrison built a statistical system using the same features, vowel-resonance movement and mean pitch, then tested it using a compressed mobile call and a reverberant police interview. Its Cllr was 0.834. A system that always returns "no information" scores 1, so those features provided little useful information under the simulated case conditions.
Morrison's 2011 paper presents Cllr, log-likelihood-ratio cost, as a performance measure for LR systems. Lower values are better; 1 is the value of an uninformative system. The measure penalises a very large LR supporting a false proposition more heavily than a modest LR in the wrong direction. Measured validity "depends both on the system and the test set." If the questioned recording is a one-minute mobile call and the known recording is five minutes of interview speech, the validation pairs should reproduce those durations and channels. Studio-recording results do not describe performance on a noisy telephone comparison.
On the same test data, Enzinger and Morrison's fully automatic system achieved Cllr 0.401, compared with 0.834 for the manual acoustic analysis. Performance belongs to a particular method under particular conditions, not to voice comparison generally or to an examiner's experience.
Kelly et al. tested the commercial VOCALISE system in 2019 using forensic_eval_01, a public case-like dataset containing 223 recordings from 61 speakers, with 111 same-speaker and 9720 different-speaker comparisons. Across six configurations, pooled Cllr ranged from 0.246 for a configuration adapted to case-like conditions to 0.462 for built-in configurations. Case-relevant adaptation nearly halved the cost.
The relevant question is the Cllr measured on validation data comparable in duration, channel, language and speaking style to the recordings in the case. A Tippett plot shows cumulative same-speaker and different-speaker comparisons against log LR and should include credible-interval bands. If performance is supported only by experience or training, the error rate may remain, in the words of the Angleton ruling quoted by Enzinger and Morrison, "unknown and may vary considerably, depending on the conditions of the particular application." Daubert asks whether the technique "can be (and has been) tested."
“A system which always responded with a likelihood ratio of 1, and therefore gave no information to assist the trier of fact in making their decision, would result in a Cllr-pooled value of 1.”
What’s your Cllr?
The witness has concluded the recordings offer "substantial support" for the prosecution. Counsel asks what that conclusion is worth.
"You concluded the recordings offer ‘substantial support’ that my client is the speaker. What is the Cllr of your method, measured on test recordings that match the duration, channel, and speaking style of the two recordings in this case? And if you have never measured it, how is the jury to know your method performs any better than a system that simply answers ‘same speaker’ every time?"
Three places the number falls apart
A likelihood ratio depends on several modelling decisions. The first is the relevant population. Its denominator asks how typical the questioned voice is among other speakers, so the analyst must define those speakers.
Hughes and Foulkes (2015) used the same New Zealand English vowel data with reference populations matched, mismatched or mixed by social class and age. For social class, the matched system had Cllr 0.513 and the mismatched system 0.659. For age, the corresponding values were 0.561 and 0.712. Changing between matched and mismatched populations shifted some individual LRs by more than a factor of ten. The authors note that "one cannot know for certain the sociolinguistic community to which the offender belongs." The chosen population must therefore be justified and its uncertainty acknowledged.
The second set of decisions concerns calibration and recording conditions. Morrison's 2017 paper examined a New South Wales case in which an automatic system used a reverberant jail landline call saved as MP3 for same-speaker training, pristine head-mounted-microphone studio recordings for different-speaker training, and a questioned mobile call recorded from beneath a mattress. No calibration step was used. Morrison's replication produced Cllr 0.957, close to the uninformative value of 1, and values averaging 18% higher than an unbiased version. Better reference conditions and calibration reduced Cllr to 0.674. The reported utterance-level values of 1.6 to 5.5 therefore carried little demonstrated information.
Third, experts may diverge. Cambier-Langeveld's 2007 exercise sent one constructed case to twelve experts in ten countries. For Q10, an 18-second different-speaker clip, three participants reported same-speaker conclusions. Automatic systems produced LRs for true same-speaker comparisons from about 40 to 40,000, and for true different-speaker comparisons from 4.36 × 10⁻²³ to about 6. The range shows that method and implementation can materially change the answer.
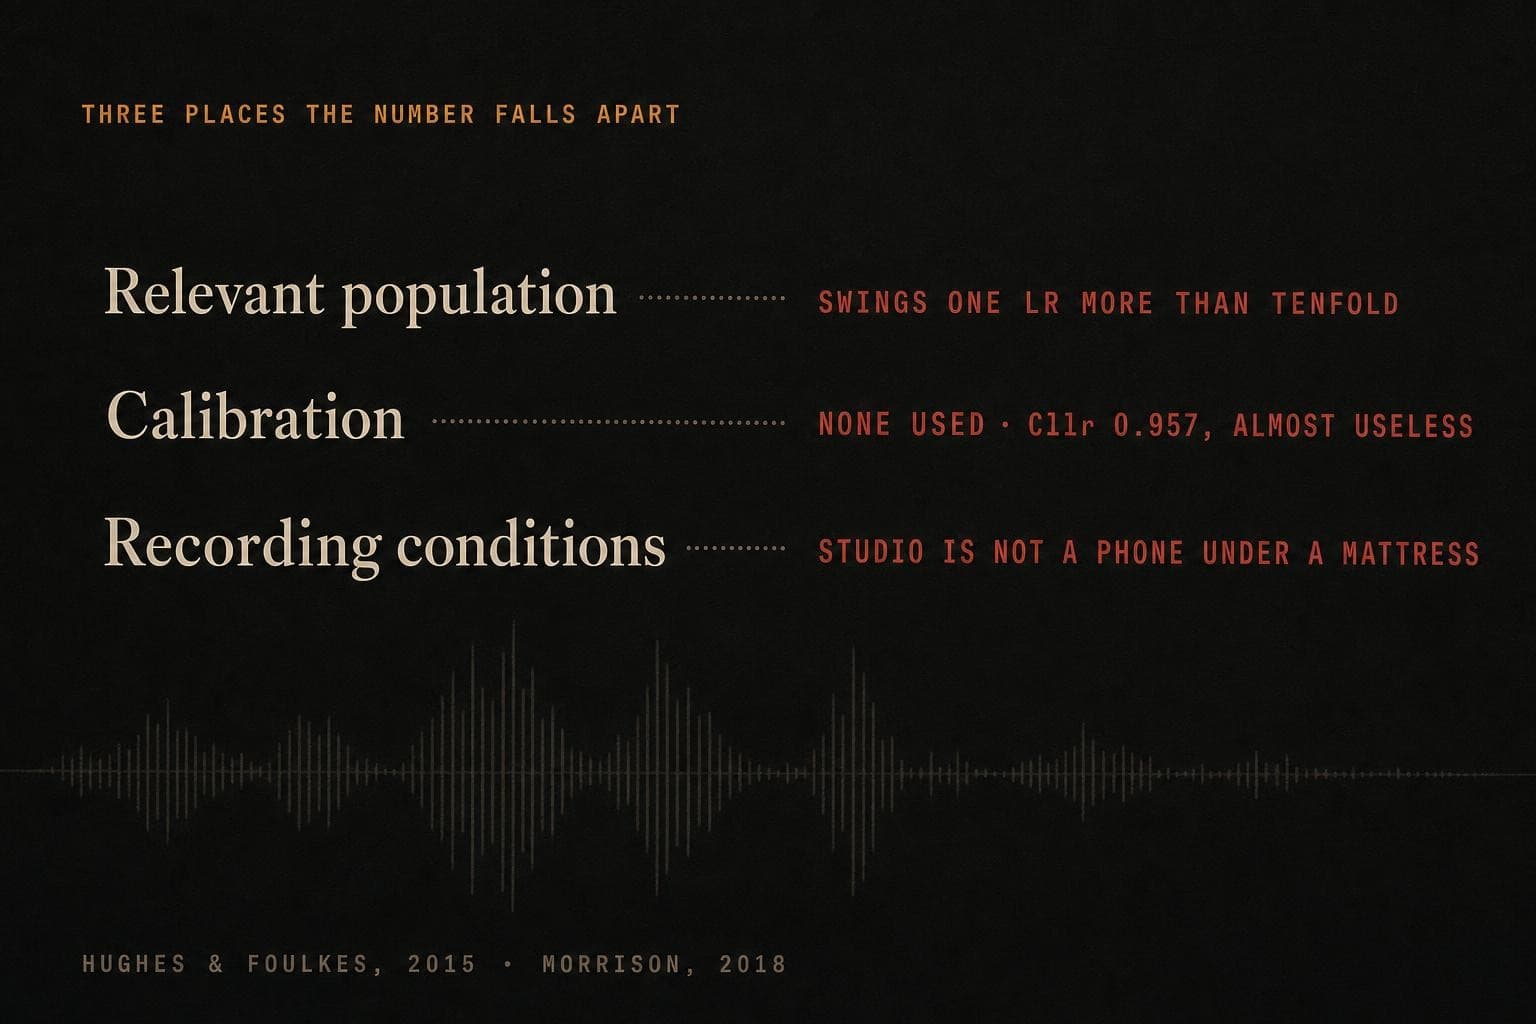
Be ready to identify the relevant population and explain its selection, describe calibration, and show that the validation data reproduce the case channel, codec, noise level and duration. Weakness in any of those components affects the meaning of the LR.
“A system which gives no useful information, a system that always outputs a likelihood ratio of 1 irrespective of the input, will have a Cllr of 1. The first variant of the system had a Cllr very close to 1.”
How did you pick the population?
The witness reported a likelihood ratio in the hundreds. Counsel goes straight at the typicality term it depends on.
"You reported a likelihood ratio in the hundreds. That number depends on comparing my client's voice against some group of ‘other speakers.’ You had to choose that group. I'm instructed that changing it can move a result like yours more than tenfold. So how did you decide which population to compare against, when the whole question in this trial is who the speaker was, and what does your number become if you chose the wrong group?"
Bias, and the witness who never heard the suspect
Two distinct human-factors issues arise in voice evidence: contextual bias affecting experts and memory limitations affecting earwitnesses.
Kukucka, Kassin, Zapf and Dror surveyed 403 forensic examiners in 21 countries in 2017. Participants estimated their own accuracy at a mean of 96%; 148, or 37%, claimed 100% accuracy. While 71% regarded cognitive bias as a concern in forensic science, 52% saw it as a concern in their own discipline and 26% thought their own judgements were affected. This is the bias blind spot. Seventy-one per cent believed they could reduce bias by trying to set expectations aside. The authors say effort is not a sufficient remedy because bias can operate automatically and without awareness. Procedural controls, including Linear Sequential Unmasking, regulate what information is received and when. Laboratories adopting them reported that they were neither onerous nor expensive.
If a voice examiner knew the police theory, suspect history or existence of a confession before forming an opinion, the relevant question is what procedure limited that information. Saying it was put aside does not remove the exposure.
Earwitness evidence presents a different problem: memory for an unfamiliar voice is weak. Yarmey and colleagues compared six-voice line-ups with a single-voice showup. Correct identification was poor in both, and showups produced more false identifications of innocent people. Clifford and Denot found accuracy near 50% shortly after exposure but 9% after one to three weeks. In Orchard and Yarmey's study, whispered speech reduced identification accuracy, and confidence in a distinctive voice did not improve performance. Across Yarmey's studies, confidence and accuracy correlated at about .25. People able to recognise a schoolmate's face years later could not reliably distinguish familiar from unfamiliar voices even after seven speech samples.
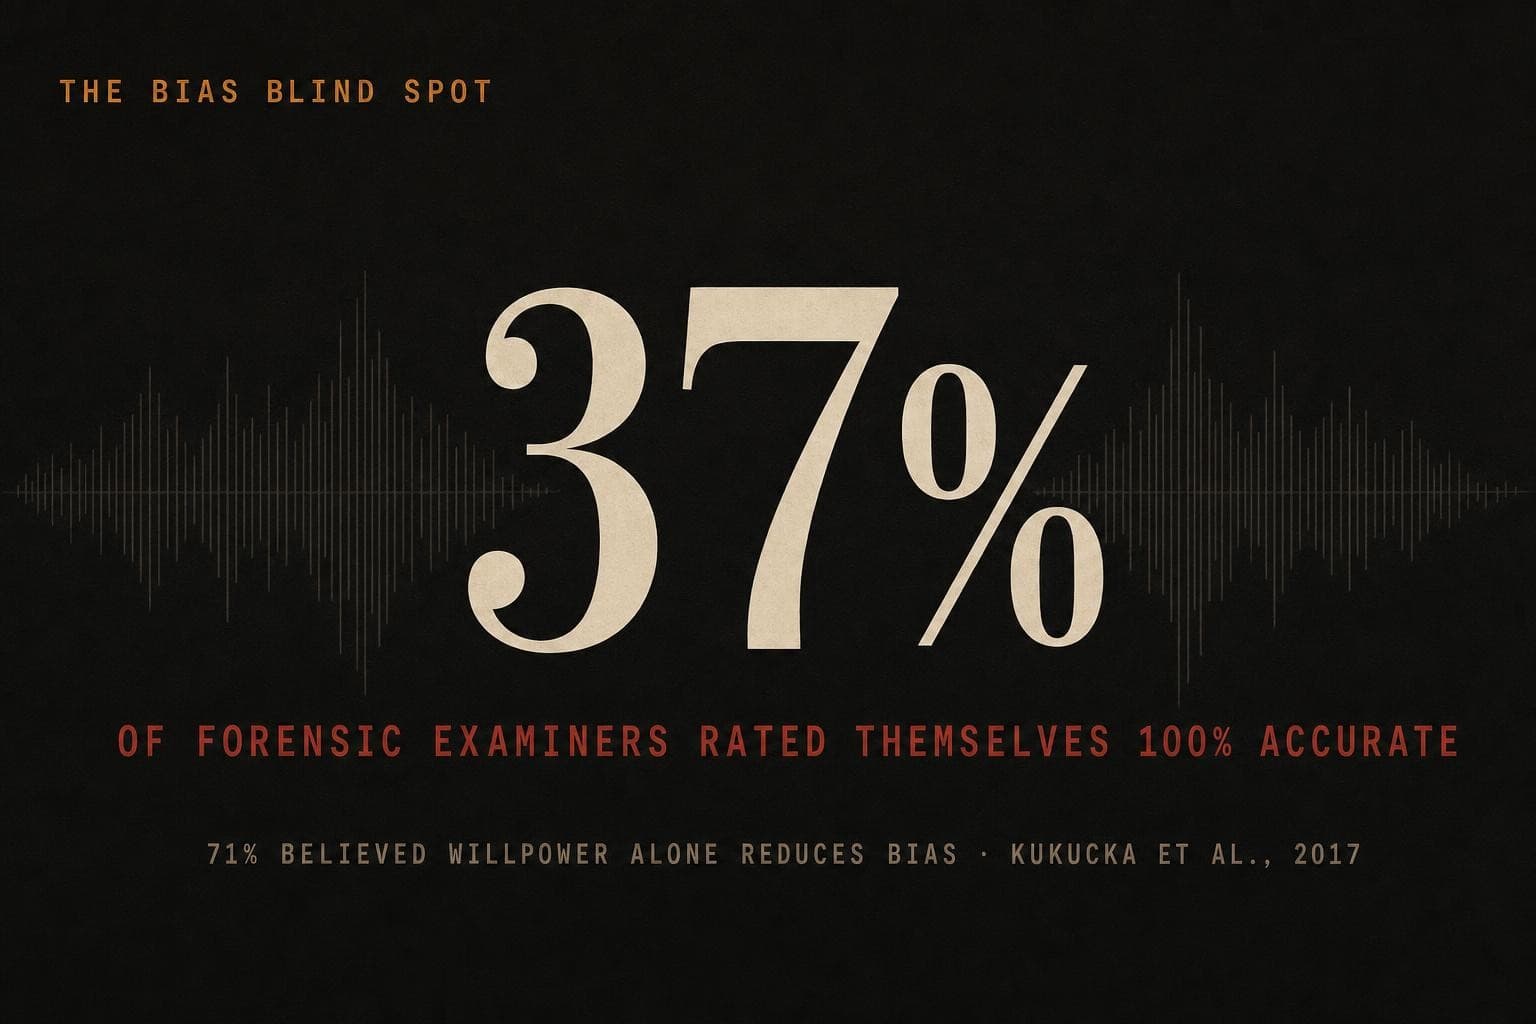
Do not treat a calibrated system comparison and an earwitness identification as equivalent. They involve different mechanisms, performance evidence and safeguards. Expertise may improve technical comparison, but it does not establish immunity from contextual bias.
“148 examiners (36.72% of the total sample) reported a belief that their own judgments are 100% accurate.”
What did you know before you listened?
Counsel turns from the method to the mind running it, and asks what the witness knew before forming a view.
"Doctor, you told the jury your method is rigorous, yet a survey of 403 forensic examiners found most thought willpower alone could neutralise bias and 37 percent rated themselves 100 percent accurate. Before you formed your opinion in this case, did you know the police theory, the suspect’s record, or that there was a confession, and what specific procedure walled that information off from your analysis?"
Is the recording even of a real person?
A voice case may now require authentication before speaker comparison. Liu and colleagues reported the ASVspoof 2021 challenge, which received submissions from 54 teams across three tasks, including fabricated speech "in the voice of a target speaker." On the deepfake progress data, 23 of 33 systems achieved equal error rates below 10%, with the best below 1%. On the less familiar evaluation data, every system exceeded 15%. Performance did not generalise from the development material.
Some detectors had learned the duration of silence at the beginning and end of clips, a feature of the training corpus rather than synthetic speech. Removing non-speech with a voice-activity detector meant performance "is substantially degraded." The paper warns that a countermeasure using a database artifact is unlikely to "lead to reliable detection in the wild." A detector validated on known attacks may therefore miss speech produced by an unfamiliar cloning method.
Language analysis for the determination of origin (LADO) raises a separate issue. Patrick and Fraser note that language varieties do not follow national borders, speakers accommodate and change during displacement, and some analysts are native-speaker informants without linguistic training. A categorical opinion that a person is not from a country may affect an asylum or deportation decision despite limited evidential support. Any opinion should be confined to observed linguistic features and the limits of the available population data; in some cases no origin opinion can be supported.
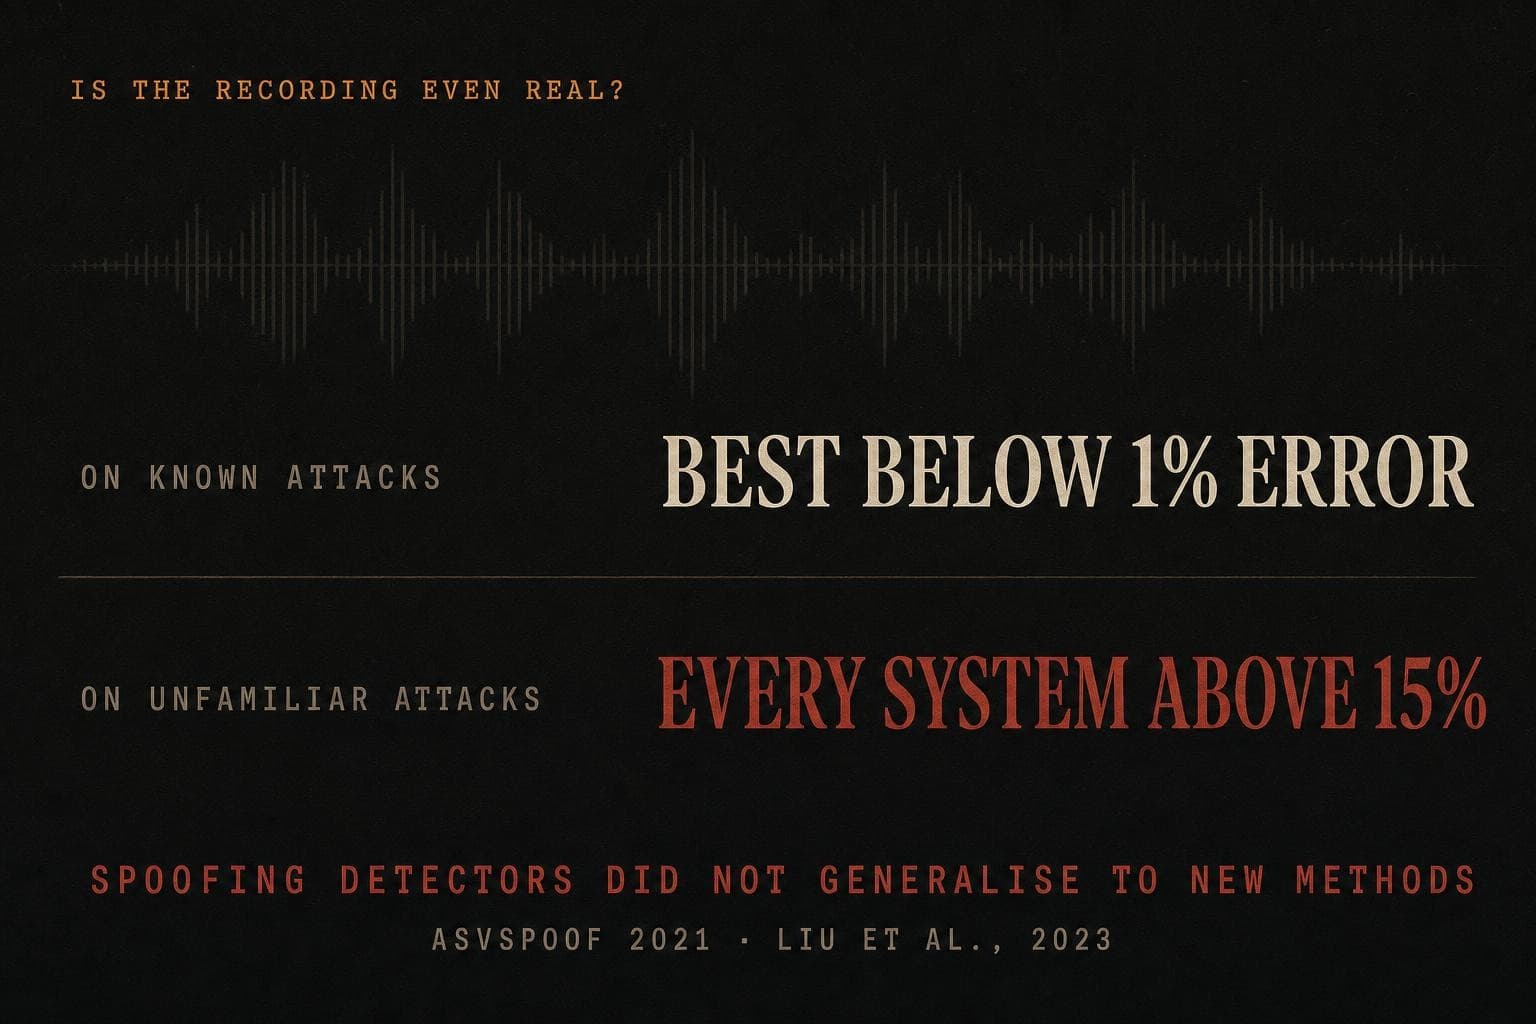
A witness should not guarantee that a recording is a human utterance rather than a clone. A spoofing detector tested on known attacks may not generalise to new ones, while speaker comparison may assume that the questioned sample is authentic. Partial spoofing is especially difficult: the ASVspoof authors note that replacing "I won the election" with "I lost the election" changes the meaning while leaving most of the recording unaltered. The report should state which authentication assumptions were tested and which remain unresolved.
“While 23 (out of 33) systems have EERs of less than 10% for the progress subset, and while the best performing system even has an EER of less than 1%, all have EERs exceeding 15% for the evaluation set.”
Relative scientific footing across the six moves in this reading, from a calibrated likelihood ratio on case-matched recordings down to claims the literature cannot support. Bar length is illustrative, not a measured metric.
- 01"I matched the voiceprints" is the sentence that ends a career. Spectrogram eye-matching was never validated, and even the court that admitted it refused the fingerprint analogy the word smuggles in.
- 02A likelihood ratio answers the evidence, not the verdict. It is not the probability your suspect is guilty, and saying so is the prosecutor’s fallacy. It means nothing until the system is calibrated.
- 03A method’s accuracy is a measured number, the Cllr, on test recordings that match this case’s channel, duration, and speaking style. A useless system scores 1, and "off the shelf" is not "tuned to the case." Ask for the number and the Tippett plot.
- 04The number rests on three judgements: the relevant population, calibration, and condition match. Change the population alone and a single comparison can swing more than an order of magnitude. Be ready to defend each choice, including the one you made without knowing who the offender was.
- 05Keep the expert and the earwitness apart. Your instrumented, calibrated comparison is not a frightened bystander’s memory of a masked voice, and your expertise does not exempt you from bias. Willpower is not a debiasing procedure; controlling what you were told, and when, is.
- 06You cannot guarantee the recording is a living human and not a clone. Your spoofing detector was validated on known attacks and may not catch a new one. And you do not infer nationality from speech.
Is it even a human?
The recording in this case is of unknown provenance. Counsel asks the question that now comes before "who is speaking."
"Your countermeasure was tuned against the spoofing attacks in the challenge data. The recording in this case was, you concede, of unknown provenance. Can you tell this jury, to any stated degree of confidence, that it was produced by a living human and not by a voice-cloning tool released after your detector was validated?"
Still have questions about the research?
Ask anything about the forensic voice-comparison literature. The tutor answers from the document itself — and keeps one eye on how it might come up under cross-examination.
- Begault, D. R., & Poza, F. (2005). Voice identification and elimination using aural-spectrographic protocols. In Audio Engineering Society Conference: 26th International Conference: Audio Forensics in the Digital Age.
- United States v. Williams, 583 F.2d 1194 (2d Cir. 1978).
- Morrison, G. S. (2009). Forensic voice comparison and the paradigm shift. Science & Justice, 49(4), 298–308.
- Morrison, G. S. (2011). Measuring the validity and reliability of forensic likelihood-ratio systems. Science & Justice, 51(3), 91–98.
- Morrison, G. S. (2013). Tutorial on logistic-regression calibration and fusion: Converting a score to a likelihood ratio. Australian Journal of Forensic Sciences, 45(2), 173–197.
- Morrison, G. S., & Enzinger, E. (2017). Multi-laboratory evaluation of forensic voice comparison systems under conditions reflecting those of a real forensic case (forensic_eval_01). Speech Communication, 85, 119–126.
- Enzinger, E., & Morrison, G. S. (2017). Empirical test of the performance of an acoustic-phonetic approach to forensic voice comparison under conditions similar to those of a real case. Forensic Science International, 277, 30–40.
- Morrison, G. S. (2018). The impact in forensic voice comparison of lack of calibration and of mismatched conditions between the case-relevant data and the calibration/training data. Forensic Science International, 283, e1–e3.
- Kelly, F., Fröhlich, A., Dellwo, V., Forth, O., Kent, S., & Alexander, A. (2019). Evaluation of VOCALISE under conditions reflecting those of a real forensic voice comparison case (forensic_eval_01). Speech Communication, 112, 30–36.
- Hughes, V., & Foulkes, P. (2015). The relevant population in forensic voice comparison: Effects of varying delimitations of social class and age. Speech Communication, 66, 218–230.
- Cambier-Langeveld, T. (2007). Current methods in forensic speaker identification: Results of a collaborative exercise. International Journal of Speech, Language and the Law, 14(2), 223–243.
- Kukucka, J., Kassin, S. M., Zapf, P. A., & Dror, I. E. (2017). Cognitive bias and blindness: A global survey of forensic science examiners. Journal of Applied Research in Memory and Cognition, 6(4), 452–459.
- Yarmey, A. D. (1995). Earwitness speaker identification. Psychology, Public Policy, and Law, 1(4), 792–816.
- Liu, X., Wang, X., Sahidullah, M., Patino, J., Delgado, H., Kinnunen, T., Todisco, M., Yamagishi, J., Evans, N., Nautsch, A., & Lee, K. A. (2023). ASVspoof 2021: Towards spoofed and deepfake speech detection in the wild. IEEE/ACM Transactions on Audio, Speech, and Language Processing, 31, 2507–2522.
- Fraser, H. (2011). The role of linguistics and native speakers in language analysis for the determination of speaker origin: A response to Tina Cambier-Langeveld. International Journal of Speech, Language and the Law, 18(1), 121–130.
- Patrick, P. L. (2012). Language analysis for determination of origin: Objective evidence for refugee status determination. In The Oxford Handbook of Language and Law. Oxford University Press.
- National Research Council. (2009). Strengthening Forensic Science in the United States: A Path Forward. Washington, DC: The National Academies Press.
Gait, Body and Clothing Comparison
Counsel is briefed on this literature. Take it into the witness box and practise voice comparison.